~~~~~~~~~~~~~~~~~~~~~~~~~~~~~~~~~~~~~
weinre is WEb INspector REmote. Pronounced like the word "winery". Or maybe like the word "weiner". Who knows, really.
weinre is a debugger for web pages, like FireBug (for FireFox) and Web Inspector (for WebKit-based browsers), except it's designed to work remotely, and in particular, to allow you debug web pages on a mobile device such as a phone.
Interesting places to visit:
| videos at YouTube: | http://www.youtube.com/results?search_query=weinre |
| this documentation: | http://people.apache.org/~pmuellr/weinre/ [temporary] |
| unofficial binary packages: | http://people.apache.org/~pmuellr/weinre/ [temporary] |
| issues: | https://issues.apache.org/jira/gobble-de-gook/... |
| create a new issue: | bug or new feature |
| cloneable source at Apache: | https://git-wip-us.apache.org/repos/asf/cordova-weinre.git |
| Apache repo cloned at GitHub: | https://github.com/apache/cordova-weinre |
| mailing lists at Apache: | http://mail-archives.apache.org/mod_mbox/cordova-dev/ (for weinre development) |
| discussion at Google Group: | http://groups.google.com/group/weinre (for weinre usage) |
More information on weinre's big brothers, Web Inspector / Google Chrome Developer Tools, is available at Google's Chrome Dev Tools pages and Apple's Web Inspector pages.
If you aren't familiar with FireBug or Web Inspector, weinre isn't going to make too much sense to you. weinre reuses the user interface code from the Web Inspector project at WebKit, so if you've used Safari's Web Inspector or Chrome's Developer Tools, weinre will be very familiar. If you're not familiar with Web Inspector, the links above to Google's and Apple's documentation will be useful.
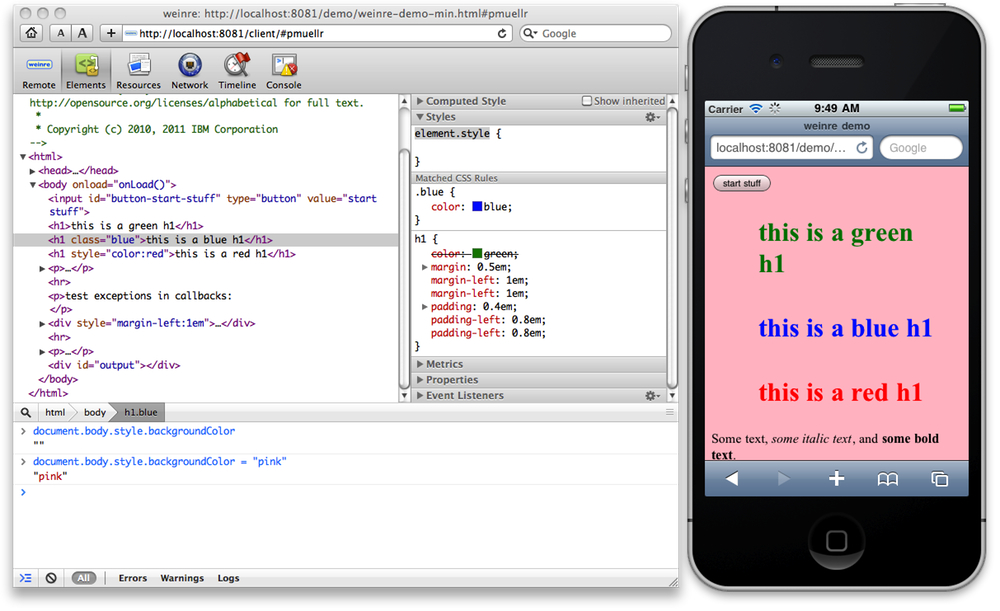
Here's an example session using weinre:

Two screen captures are shown above. On the left is the weinre client application, displaying debug information. On the right is the target web page, running in Mobile Safari in the iOS Simulator.
In normal usage, you will be running the client application in a browser on your desktop/laptop, and running a target web page on your mobile device.
In the session above, the debugger is display the Elements panel, with the embedded console expanded in the bottom third of the window. In the console area, we've entered two statements:
document.body.style.backgroundColor
document.body.style.backgroundColor = "pink"
The result of running the first statement shows the value of the body's background style is not set. The second statement sets the body's background to pink. That horrifying pink background is then rendered in the target's window.
In addition, an h1 element is selected in the upper third of the Elements panel, which causes the side panels on the right to be filled in with relevant information. In this case, the matched CSS rules for that h1 element are being shown.
If you are familiar with WebKit's Web Inspector, a partial list of differences between it and weinre are listed below:
Generally version numbers listed here are the earliest versions of the relevant thing that have been tested. Later versions of those things are also hopefully supported, but let us know.
Any platform that supports node.js.
The browser where the debugger user interface runs.
The browser with the page you are debugging.
Home
- User Interface
- Installing
- Running
- Multi-User
- Security
- Building
- ChangeLog
- License
![]()